iToll · April–December 2023
Turning fragmented vehicle debts into one trustworthy payment system
How I combined product evidence, service constraints, and interaction design to make more than ten debt products easier to choose, pay, recover, and verify.
A payment could succeed while the user’s task remained unresolved. I stopped treating the Debt List as a page and reframed it as a decision, recovery, and proof system.
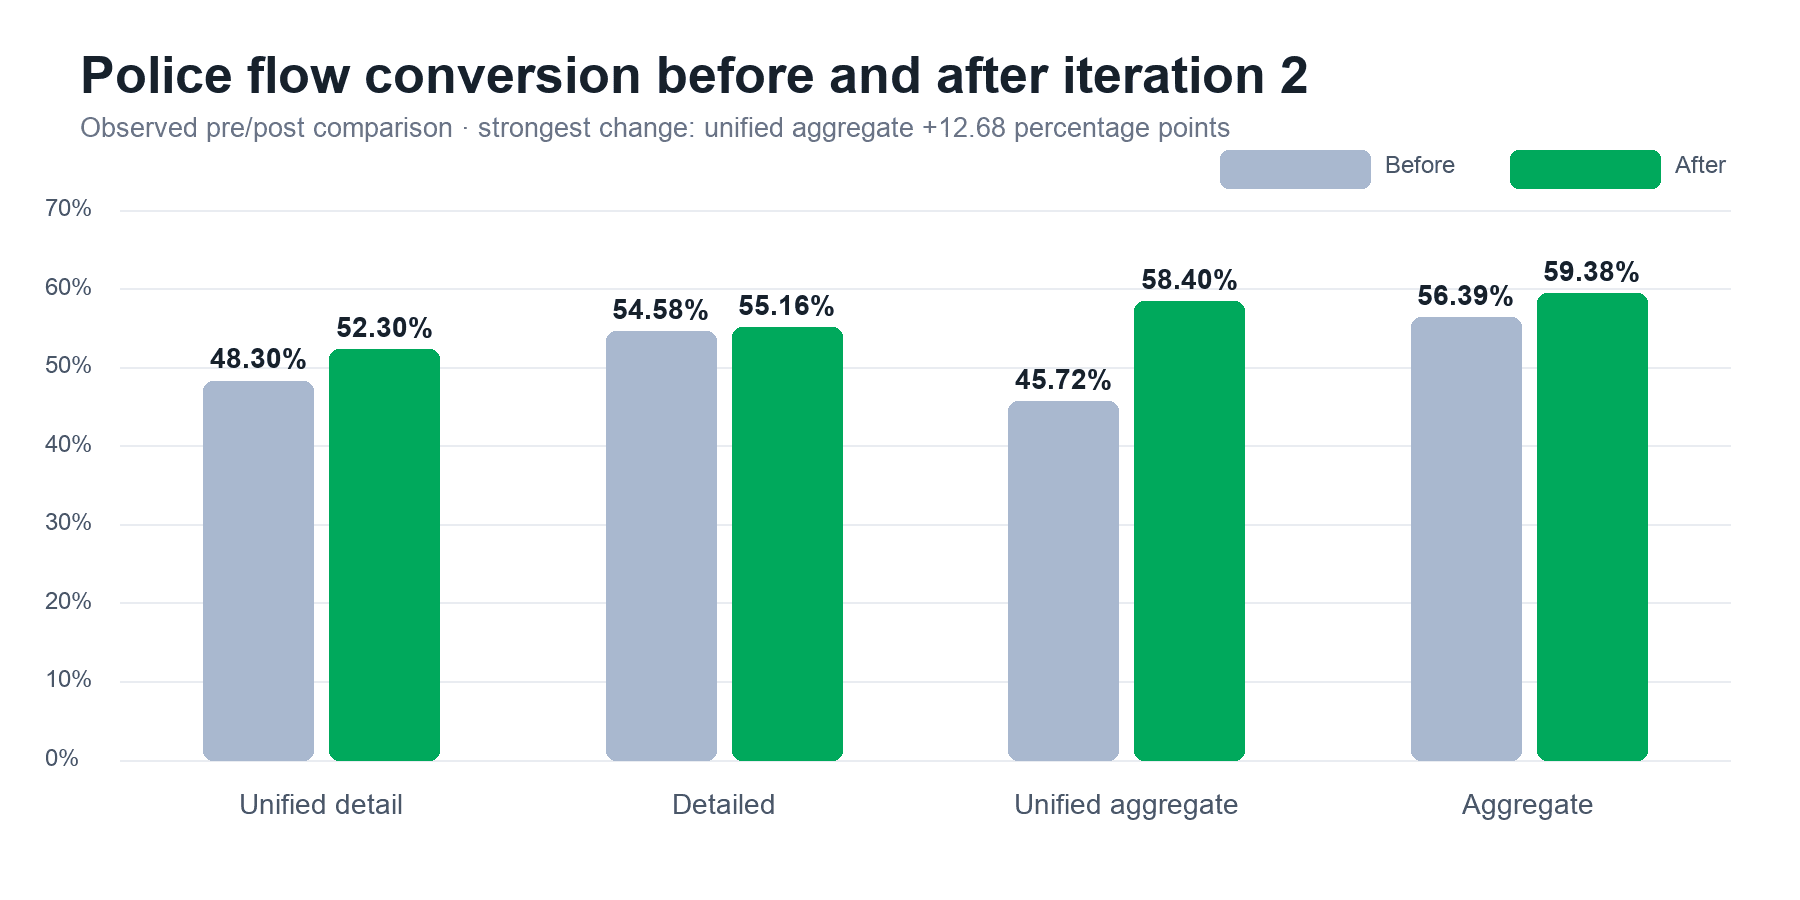
+12.68 percentage points
Observed conversion change in the unified aggregate police flow
Observed pre/post comparison · CLM-003
18.24%
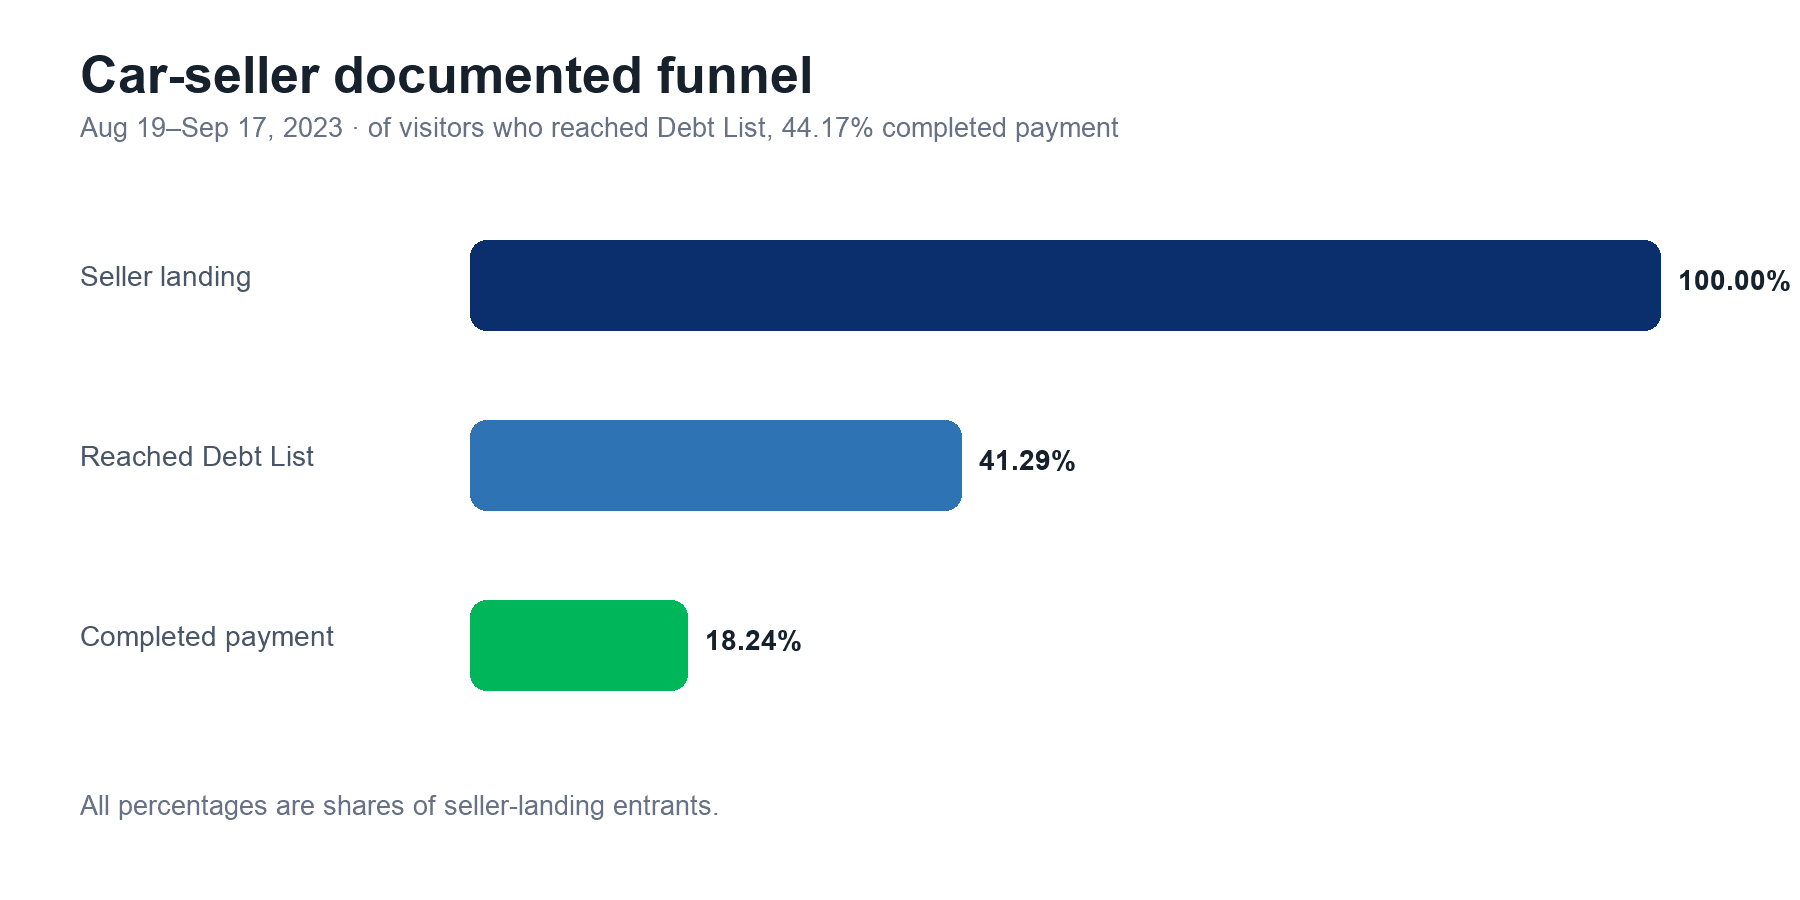
Car-seller landing-to-payment completion
Observed funnel completion · CLM-004

Case at a glance
A live service portfolio, not one predictable transaction.
- My function
- Product design with OKR, scope, prioritization, analytics, and delivery responsibilities.
- Methods
- 10 moderated usability sessions, 5 car-seller interviews, CRM/support review, funnel analysis, and prototyping.
- Constraints
- External providers, partial outages, identity rules, delayed settlement, mobile density, and uneven instrumentation.
- Evidence status
- One strong descriptive conversion result, one documented life-event funnel, and directional placement findings.
The short version
This case demonstrates how I turned fragmented, provider-constrained services into a coherent decision and recovery system by combining behavioral evidence, operational feedback, and interaction design.
iToll’s Debt vertical covered police penalties, freeway tolls, municipal charges, transfer tax, technical inspection, recurring notification products, and other vehicle obligations. Users experienced these as one job—understand what I owe and finish it—but the services behaved differently.
I combined usability research, support evidence, funnel analysis, and provider constraints to reframe the work from a visual redesign into a shared decision, payment, recovery, and proof system. The clearest recorded outcome was in the unified aggregate police flow. The evidence is descriptive rather than causal, so unverified support, CSAT, and cross-sales claims remain outside the outcome story.
In this case
01 · The challenge
Payment success did not guarantee resolution.
The visible request was to improve debt journeys. The underlying failure was larger: the interface treated multiple providers as though they followed one reliable transaction model.
A user might need only a plate for one inquiry, but a plate, national ID, owner phone, or VIN for another. Some services settled immediately; others could take 48–72 hours. One provider could be unavailable while the rest of the Debt List remained useful. A payment could return to the wallet, a fine could double, or a receipt could become necessary for a sale or notary visit.
Decision risk
Users could pay for an inquiry mode without understanding its detail, fee, or identity requirement.
Trust risk
A success state could imply closure before the external provider had settled the debt.
Operational risk
Generic errors pushed provider-specific problems into support under inconsistent taxonomies.
The business needed conversion and cross-product discovery. Users needed confidence, control, and proof. Engineering needed a system that could accommodate provider exceptions without rebuilding every journey. Success therefore meant more than a cleaner list.
02 · Research frame
What I needed to learn before redesigning anything.
- Where did confidence break—before inquiry, at payment, or after apparent success?
- Which differences between services mattered to users, and which could become shared patterns?
- Should one provider failure block the entire page or remain local to its debt card?
- What proof did users need after payment, especially when settlement was delayed?
- When did recurring products feel useful rather than distracting?
These questions determined which evidence mattered. I did not need another gallery of screens; I needed to connect behavior, service operations, and interface states.
03 · Evidence
The evidence changed the frame.
I reviewed product funnels and event definitions, studied CRM and support patterns, moderated ten usability sessions across Debt List and police work, and conducted all five interviews used to frame the car-seller journey. I also mapped provider requirements, responsive behavior, and recurring states across the product portfolio.
The support database contained more than 2,000 calls and tickets, but the available snapshots used different categories and time grains. I used them to identify recurring failure demand—settlement, repeat messages, receipt, refund, provider outage, and identity mismatch—but not to claim a percentage reduction in calls.
Early police success-card events were duplicated, so pre–September 2 and later values were not directly equivalent. Instead of selecting the most flattering trend, I treated the cleaner iteration report as the main outcome source and kept the broader weekly series as directional context.
Recreated for publication
One list. Independent recovery states.
Provider unavailable
Retry this debt while the rest of the list remains usable.
Information mismatch
Correct the relevant vehicle or identity details without restarting.
Record not found
Explain the constraint and preserve access to other payable debts.
04 · Product decisions
Four choices shaped the product.
Decision 1
Keep provider failure local instead of collapsing the page.
- Signal
- Different providers could return successful, delayed, unavailable, or mismatched results in the same session.
- Options
- Show one page-level state, remove failed products, or let each debt card own its status and recovery.
- Choice
- I designed independently stateful cards. A user could retry one provider, correct vehicle information, understand a delay, or continue paying another debt without losing the rest of the session.
- Accepted trade-off
- The page and engineering state model became more complex. We accepted that because hiding variability would only move its cost to users and support.
Decision 2
Explain the police inquiry trade-off before commitment.
- Signal
- Inquiry modes differed in required inputs, fee, detail, and eligibility. Earlier flows made users discover those differences through form behavior.
- Options
- Default to one mode, reveal the alternative later, or present the choice before payment.
- Choice
- I made aggregate versus detailed inquiry explicit, with value, required inputs, fee, and consequences attached to each option. Plate and identity editing remained available.
- Accepted trade-off
- An explicit choice adds a moment of consideration. The alternative was faster only when the default happened to match the user’s need.
In the iteration-two report, the unified aggregate path recorded the strongest change, moving from 45.72% to 58.40%. Other paths moved by smaller amounts, so the case does not generalize one uplift to every police journey.
Decision 3
Design beyond the green success screen.
- Signal
- Customer feedback showed that “paid” and “resolved” were not always the same. Users could see the debt again, wait for settlement, need a receipt, or receive a wallet refund.
- Options
- End at payment success, add explanatory copy, or represent payment, provider settlement, proof, refund, and remaining debt as distinct states.
- Choice
- I treated after-payment as part of the transaction. The experience carried the amount, vehicle, tracking details, settlement expectation, receipt or certificate, remaining obligations, and a recovery route.
- Accepted trade-off
- This required more back-end states and coordination with messaging and support. The dependency was later resolved and the scope shipped.
Decision 4
Place retention offers after demonstrated intent.
- Signal
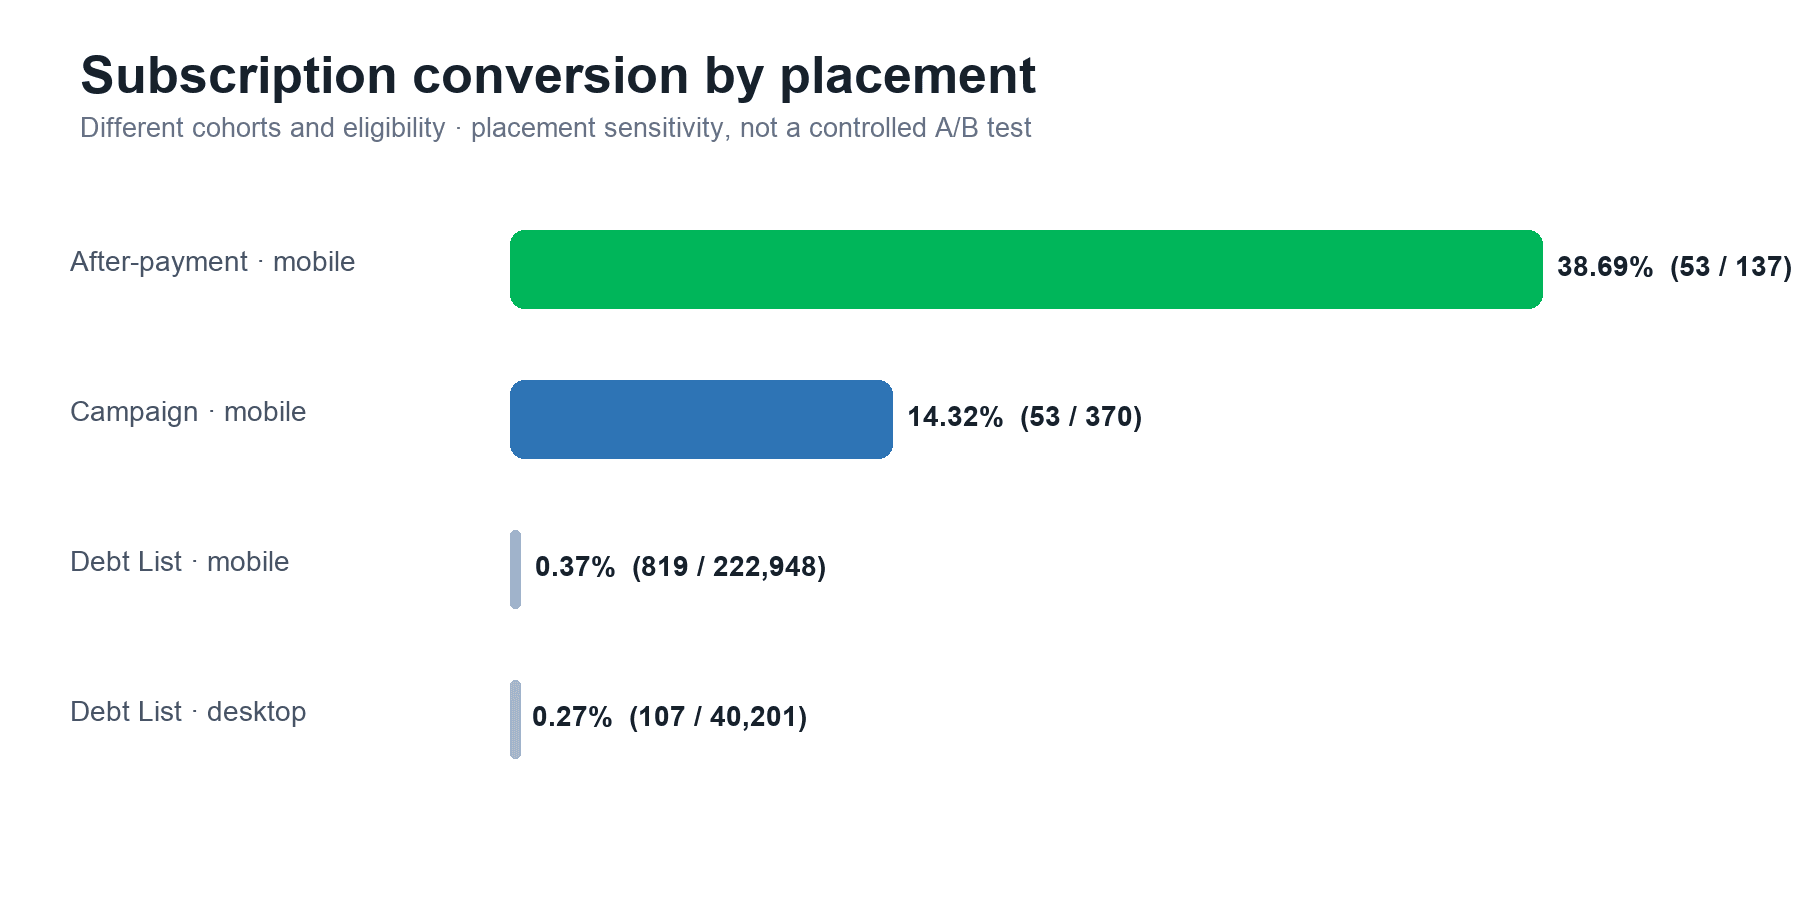
- Annual notification subscription conversion varied sharply by placement: 38.69% after payment on mobile versus 0.37% on Debt List mobile and 0.27% on desktop.
- Options
- Maximize generic exposure, repeat the offer throughout the flow, or wait until the user had demonstrated debt-management intent.
- Choice
- I favored contextual offers after a meaningful action, where “help me avoid this next time” matched the user’s immediate experience.
- Accepted trade-off
- Contextual placement produces fewer impressions. The cohorts were not a controlled A/B test, so the pattern is directional rather than causal.
05 · Experience and craft
A responsive transaction workspace.
On desktop, debt cards remained primary while a side panel held wallet, payment method, payable items, total, and the payment action. On mobile, the same model collapsed into a single column with a persistent payment action, keeping selected amounts and recovery states close to the task.
The craft was concentrated in states and content.
- Every debt card could be selectable, informational, delayed, failed, unavailable, or in need of corrected vehicle data.
- Icons, borders, labels, and written instructions reinforced one another instead of relying on color alone.
- Error copy explained whether to retry, edit information, wait, contact support, or continue with other debts.
- Fee, settlement, refund destination, and provider responsibility appeared near the decision they affected.
- Shared components covered police, freeway, municipal, transfer-tax, subscription, wallet, and proof patterns while preserving service-specific rules.
The system also made a new product shape possible. Five car-seller interviews showed that users did not think in product categories; they thought about being ready to transfer ownership. The team could combine relevant debts, identity requirements, sequence guidance, and proof around a life event rather than another isolated inquiry.
06 · Evidence and outcomes
What changed—and what the evidence can support.
What shipped
The team delivered the shared Debt List and after-payment direction, provider-specific recovery, police inquiry changes, wallet and payment behavior, late-fine and no-default-selection work, annual notification subscription, automatic inquiry, and related driver-profile and gamification scope. The design language connected more than ten debt and compliance products rather than optimizing one isolated page.
+12.68 percentage points
Unified aggregate police conversion moved from 45.72% to 58.40%, or +27.7% relative, in an observed pre/post comparison.
18.24% end to end
41.29% reached Debt List; 44.17% of that group paid; 18.24% completed the car-seller landing-to-payment journey.
92% of 6,718 buyers
Negative-score buyers also bought approximately two other products on average. This supports cross-product relevance, not a growth claim.
07 · Reflection
Measurement before persuasion.
I am proudest of changing the unit of design. Once I stopped treating Debt List, payment, settlement, and support as separate surfaces, the team could make provider uncertainty explicit without making the experience feel broken. The work also showed me that designing the measurement contract is part of designing the product.
If I revisited the project, I would define the warehouse event model and stable denominators before the next major release. I would use a controlled or staggered rollout for high-impact choice and placement changes, and measure settlement confidence and first-contact resolution alongside payment conversion.
In a high-stakes payment product, reassurance is not decoration after the transaction. It is part of the transaction.
Last reviewed July 25, 2026 · Published with aggregate metrics, anonymized customer feedback, representative product data, and privacy-safe interface exports.